Where the current reaches, and where it does not
Simulation of the electric field induced by transcranial electric stimulation, in the browser, with nothing to install.
Simulation of the electric field induced by transcranial electric stimulation, in the browser, with nothing to install.
Electrodes are selected on a 3D head model, assigned as anodes or cathodes, and a total current is set; the tool then shows the resulting electric field on the cortical surface. The computation is immediate: no job queue, no waiting.
It is meant for the moment before the experiment, when electrode placement is being decided and two montages need to be compared without preparing a full simulation for each one.
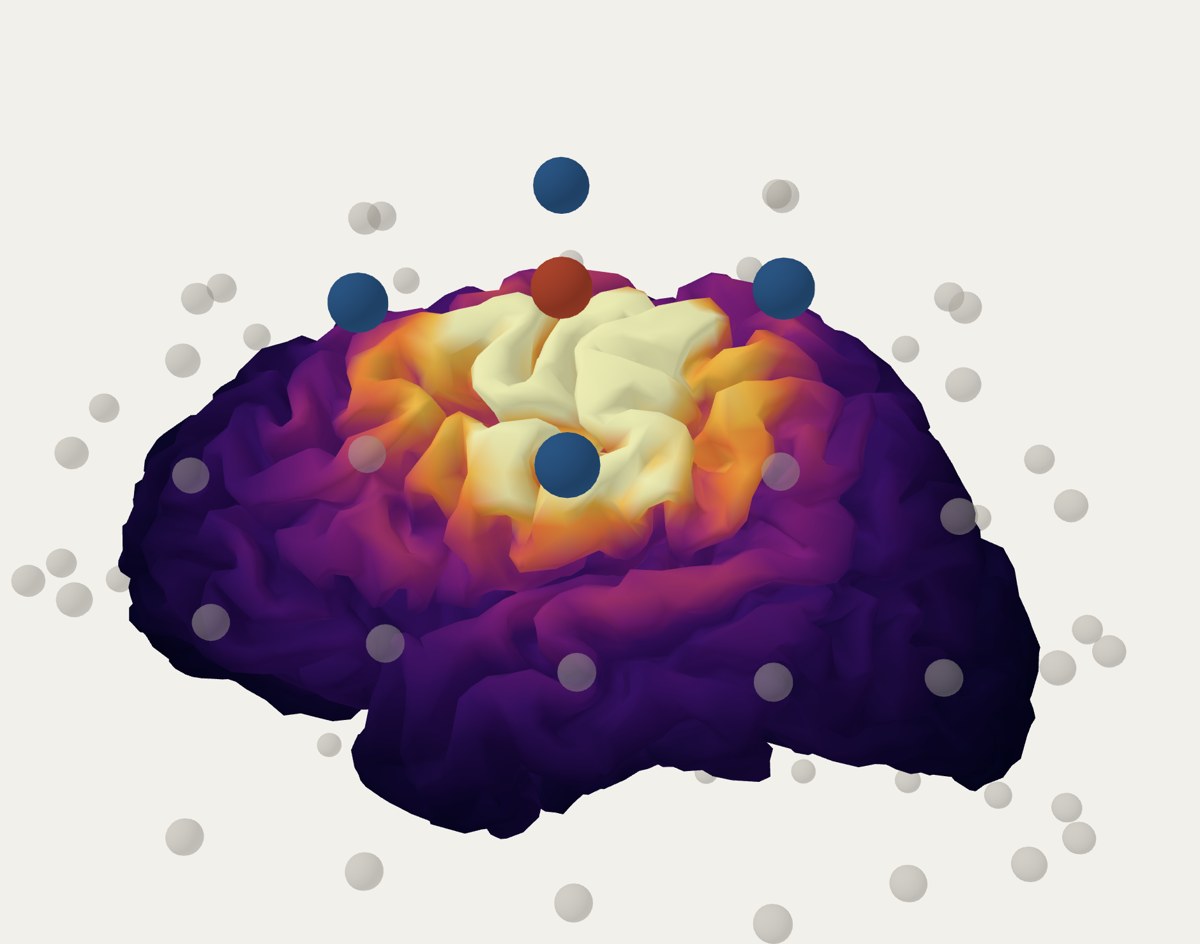
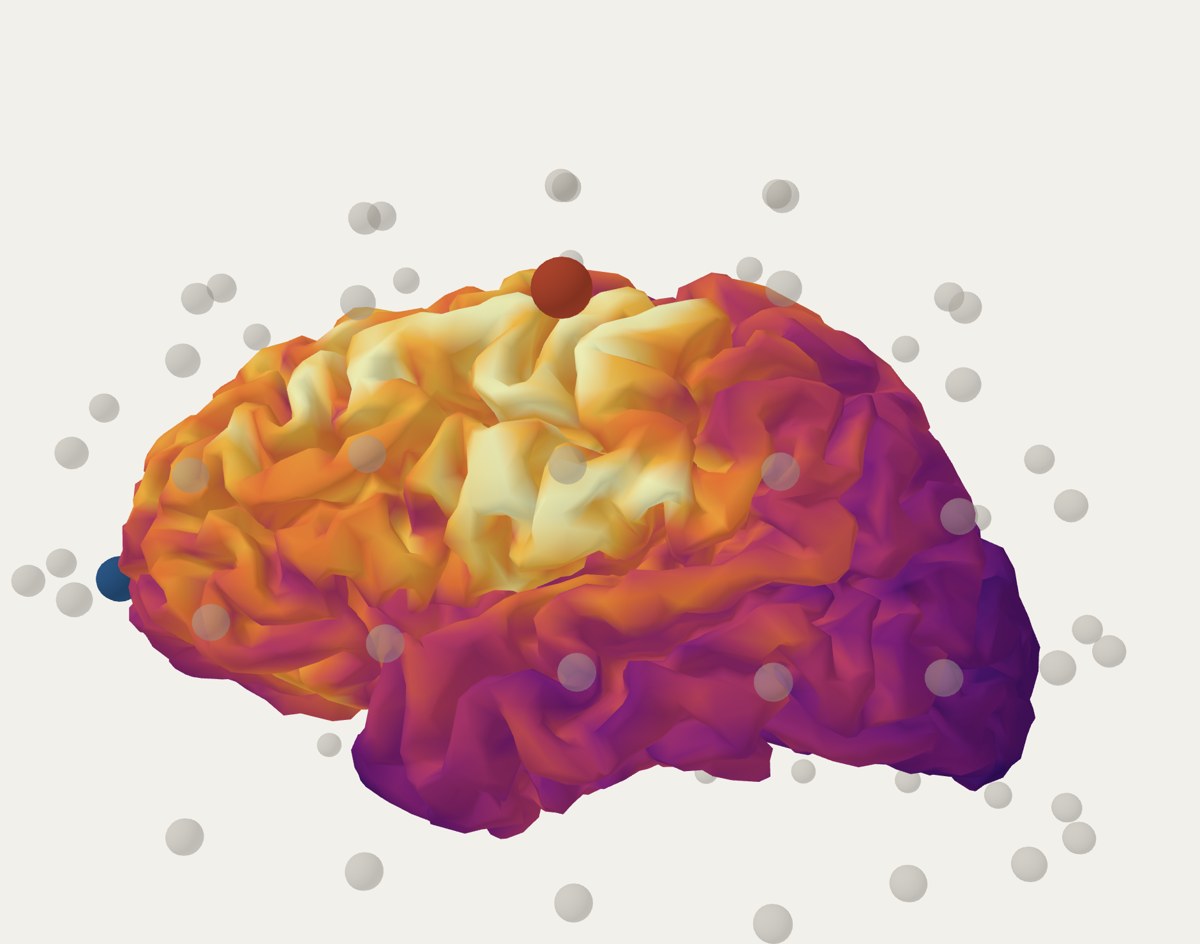
Both montages aim at the same place. The classic one spreads the field over seven times more cortex; the HD 4×1 concentrates it and loses intensity. That is the decision the tool puts on the table before anything is set up.
The field of any combination of electrodes is the weighted sum of the individual solutions. That sum is not an approximation: it is exact for the model that was solved.
The foundation is a leadfield: the electric field solution for each electrode on its own, computed once with finite elements and stored. Since the problem is quasi-static and ohmic, recombining is enough.
The magnitude is the field strength, regardless of its direction.
The normal component is the projection of the field onto the perpendicular to the cortical surface. It is positive when the field points into the cortex and negative when it points out of it. It is the component most closely related to neuronal polarisation, and therefore the one usually reported.
The three metrics reported with each montage are deliberately conservative:
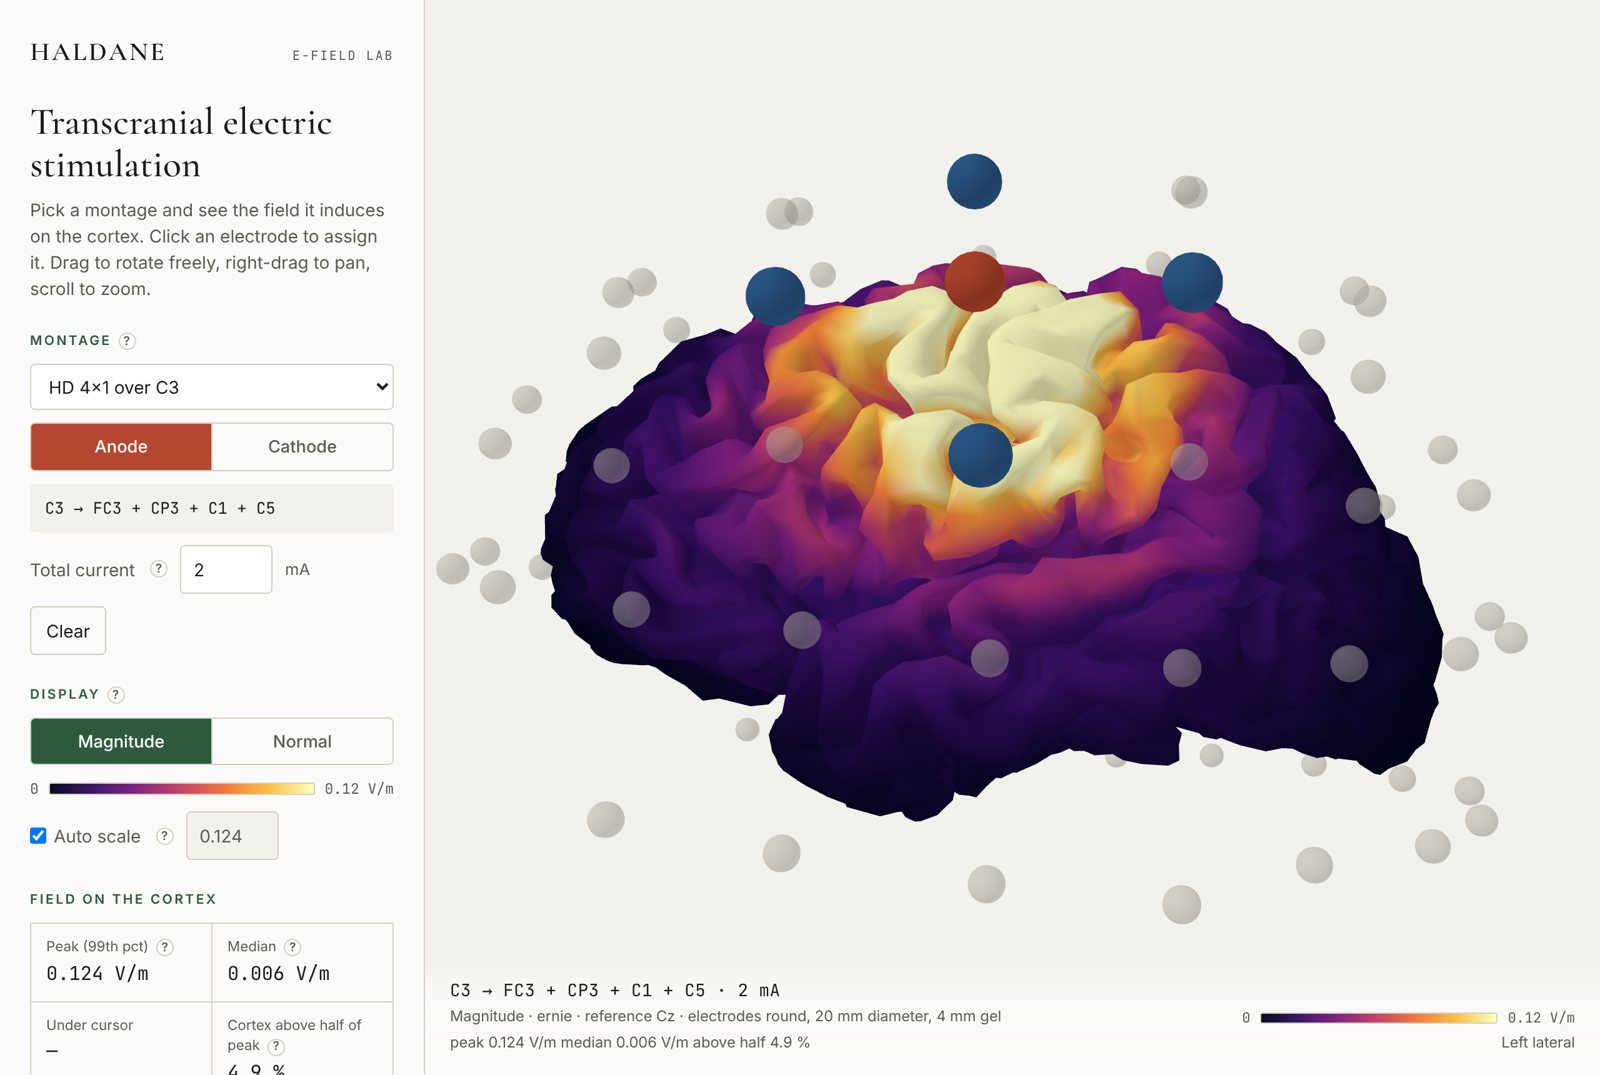
Figures are exported as PNG with the caption already written: montage, current, model, reference electrode and electrode geometry. The on-screen value layer can also be turned off.
It is not a medical device and does not replace a subject-specific simulation. For a real protocol, the right thing is still to run SimNIBS on that person's MRI.
Jones, S. R. (2026). E-Field Lab: browser-based simulation of the electric field in transcranial electric stimulation (v1.0.0). Haldane Genomics. doi.org/10.5281/zenodo.22867607
SimNIBS, the software that solves the physics behind the tool, should also be cited: Thielscher, A., Antunes, A. and Saturnino, G. B. (2015). Field modeling for transcranial magnetic stimulation: a useful tool to understand the physiological effects of TMS? IEEE EMBC.
The code and the computation scripts are published at github.com/Omega-Collective/omega-efield-lab. To reproduce the leadfield, or if a model with a different electrode geometry is required, write to [email protected].